Introduction of iperf3 and iftop
Note
Author: Wei, Chang
Date: 2026/01/14
Introduction
free5GC requires measuring dataplane (GTP‑U) maximum available bandwidth and behavior to ensure it can carry UE traffic under high load or production-like conditions. We use iperf3 as a controllable traffic generator and throughput measurement tool, paired with iftop to observe per-connection bandwidth usage and direction in real time on UPF interfaces (for example, monitor outer GTP‑U traffic on upfgtp).
What is iperf3?
A tool for network performance measurement and traffic generation, commonly used to evaluate throughput between two endpoints, and in UDP mode it can measure jitter and loss. It uses a client/server architecture: one side runs the server to listen, the other runs the client to initiate tests.
TCP mode (default)
- Measures achievable throughput (in Mbits/s or Gbits/s).
- Displays retransmissions (
Retrin output), useful to identify reliability/stability issues. - Reflects actual transfer capability under congestion control interactions (e.g., TCP window, RTT, and retransmissions).
Use cases: validate link capacity, end-to-end available throughput, or test core network dataplane under different loads.
UDP mode (-u)
- Sends packets at a target rate (client can specify bitrate with
-b). - Measures jitter and packet loss—important QoS indicators.
Use cases: evaluate latency-sensitive or real-time applications (VoIP, video streaming), or pressure-test forwarding capacity and loss behavior with a fixed send rate.
Common options (summary):
-c <host>/--client <host>: run in client mode connecting to specified host.-s/--server: start server mode (accept connections).-t <seconds>: test duration in seconds (default 10).-P <num>: number of parallel streams.-R: reverse mode—server sends to client (tests DN→UE).-d: bidirectional test.-J: output JSON format.--bind-dev <iface>: bind source interface or source IP.
iftop
-
What is iftop: an interactive interface bandwidth monitoring tool that shows per-connection (IP:port) real-time bandwidth usage on a specified interface, including short/medium/long averages.
-
Why use iftop:
- Quickly identify which interface or connection is consuming bandwidth—suitable for real-time troubleshooting and initial diagnosis.
- Shows direction and rate per connection, helpful during high-traffic tests to confirm traffic source/direction (e.g., DN→UE vs UE→DN).
- Low startup and observation overhead; suitable as a runtime monitoring tool during tests.
Common options (summary):
-i <iface>: specify interface to watch.-n: do not resolve hostnames.-N: show port numbers instead of service names.-P: show port-related info.-t: text output mode.-B: show rates in bytes/s (default is bits/s).-M: set the maximum value for the top scale of the output interface
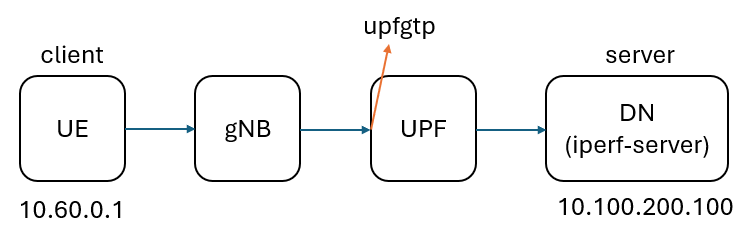
Test Environment Overview (free5GC)
Using free5gc-compose as an example, the main containers used in experiments are ue, upf, and the data network iperf-server. Typical example IPs include the UE PDU IP (e.g., 10.60.0.1), the DN (e.g., 10.100.200.100), and the Docker private network 10.100.200.0/24. The UPF important interface is upfgtp (GTP‑U outer), where outer GTP‑U traffic can be monitored.
Preparation (install tools)
After adding an iperf-server service to docker-compose.yaml, start the container:
iperf-server:
  container_name: iperf-server
  image: networkstatic/iperf3:latest
  command: ["iperf3", "-s"]
  networks:
    privnet:
      ipv4_address: 10.100.200.100
Install required tools inside containers:
-
In the
uecontainer:
apt update && apt install -y iperf3 -
In the
upfcontainer:
apt update && apt install -y iftop
TCP mode
UE → DN (iperf-server)
Run iperf3
- Replace
10.100.200.100with your actual DN IP.
docker exec ue iperf3 -c 10.100.200.100 --bind-dev uesimtun0 -t 20
Notes:
-c <host>: target host (client mode).--bind-dev <iface>: bind source interface or source IP (e.g.,uesimtun0).-t <seconds>: test duration.
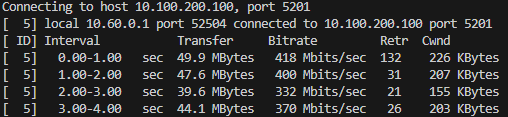
Table field descriptions:
Interval: statistics time window (default per-second).Transfer: amount of data successfully transferred during the interval.Bitrate: average throughput for the interval (bits/sec).Retr: TCP retransmissions in the interval.Cwnd: TCP congestion window at the end of the interval (KBytes).
Run iftop
docker exec -it upf iftop -i upfgtp -nB -m 500M
Notes:
-i upfgtp: interface to watch (upfgtp, GTP‑U outer).-n: do not resolve hostnames; show numeric IPs (suitable for container environments to avoid DNS delays or name masking).-N: show port numbers instead of service names (e.g., 5201 instead of iperf3).-P: show port-related info (list source/destination ports).-B: show rates in bytes/s (default is bits/s), making large values more readable.-m 500M: set the iftop scale or maximum display value to 500M (unit depends on-Bfor bytes or bits), useful to adjust display scale for high traffic.
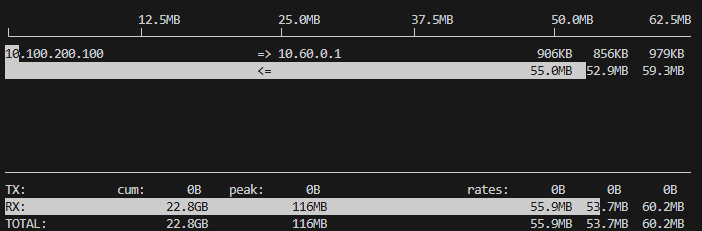
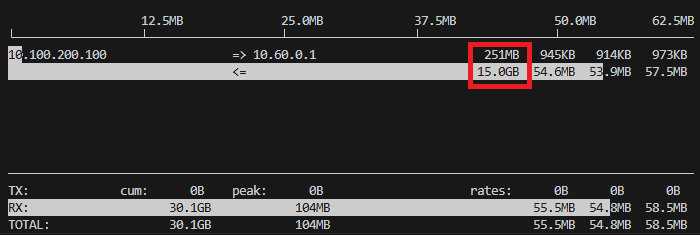
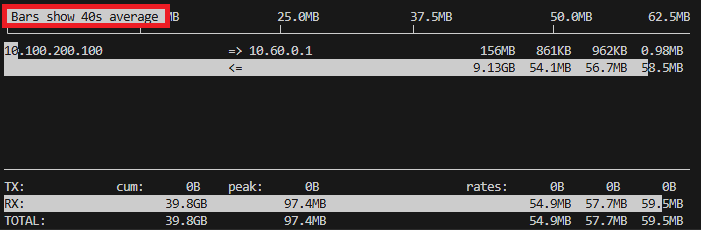
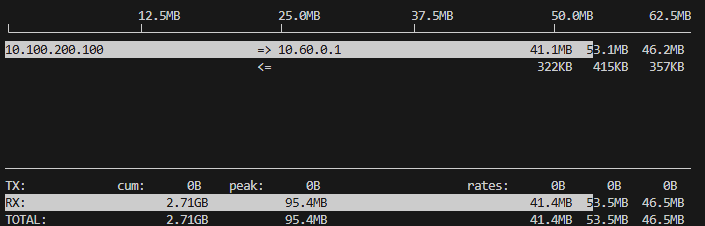
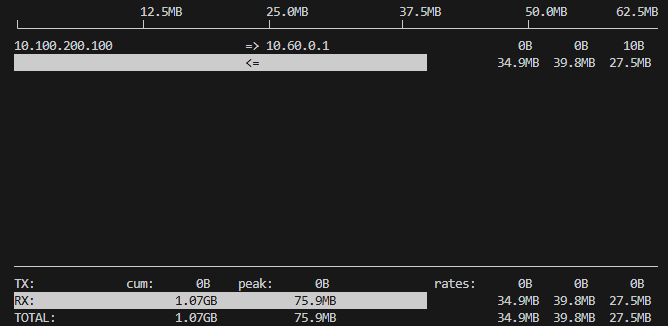
Notes:
- The white bar charts are visualizations (recent 2s, 10s, 40s averages).
- Three rate columns (short/medium/long): averages over different windows; typically left→right corresponds to ~2s, ~10s, ~40s averages (depends on iftop version).
- Bottom statistics (TX/RX / TOTAL): show cumulative (Cum), peak (Peak), and three-rate averages (Rates).
Once inside the interface
Press T to show totals for each row (Totals), useful for viewing overall transmitted amounts.
Press t to switch to single-line display (single-line mode); in this mode you can toggle showing send-only, receive-only, or combined send/receive.
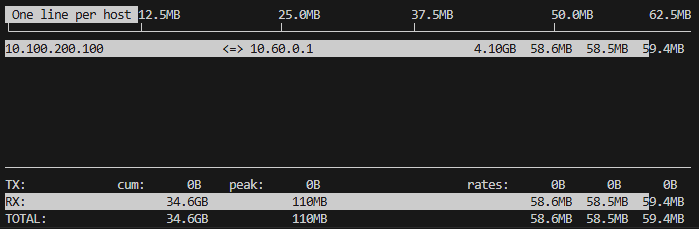
Press B to adjust the timescale windows used for the progress bars (recent 2, 10, 40 seconds), which helps observe short/medium/long-term rate differences.
DN (iperf-server) -> UE
Use -R (reverse) so the server sends data to the client (DN → UE); run the client on UE and the server will send traffic back to the UE:
docker exec ue iperf3 -c 10.100.200.100 --bind-dev uesimtun0 -t 20 -P 4 -R
UDP mode
In UDP mode, iperf3 prints jitter and packet loss statistics on the receiver (server):
docker exec ue iperf3 -c 10.100.200.100 --bind-dev uesimtun0 -u -b 300M
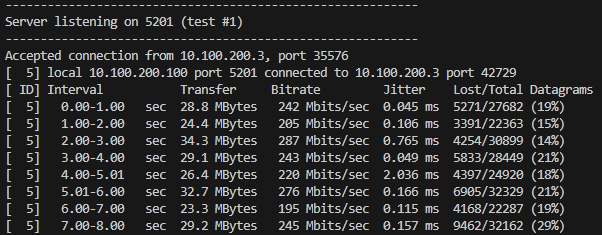
Notes:
- The above image comes from the
iperf-serveroutput (docker logs iperf-server), showing receiver-sideJitter(ms) andLost/Total Datagrams.
Conclusion
Combining interface-level real-time observation (iftop) with end-to-end measurement (iperf3) enables quick and accurate localization of dataplane issues and directs corrective actions:
- When measuring TCP with iperf3 (iftop showing the TCP traffic), the interface observed about 55–60 MB/s (≈ 440–480 Mbps).
- When measuring UDP with iperf3 and setting the target rate to 300 Mbps, the observed received throughput was about 200–287 Mbps, with packet loss rates as high as 14%–29%, indicating that substantial packet loss significantly reduces effective throughput.
Combine interface and end-to-end statistics to determine whether traffic is being dropped along the path or whether differences are due to protocol-layer behavior (TCP vs UDP).
Connect with Me
- GitHub: https://github.com/wiwi878